

Disclosure: I was able to try a demo of DeceptionPro; this blogpost was written because I’m a fan of the service and not because I was asked to write it.
In my years analyzing malware and tracking code-signing certificates, I’ve always been limited to only seeing a small glimpse of the attack. DeceptionPro offers a major solution to that problem: their service allows you to monitor activity for hours, days, or weeks* after a malware has been ran, allowing you to understand the behavior of the malware and any actions performed by an attacker.
*I never actually tried running things for weeks but it is possible. The main limitation is that the environments generated are robust and subscriptions are limited on concurrent jobs as a result; so running an operation for weeks would restrict your ability to run new jobs, with possibly little return depending on the activity you are looking to capture. We’ll talk more on this below.
In this post, we’ll talk about what DeceptionPro does to create a realistic environment and give an example of a situation where we monitored hands-on activity within the simulated environment.
Starting the deception
DeceptionPro enables you to create a realistic network for monitoring attacker activity; we’ll look at how it does that below.
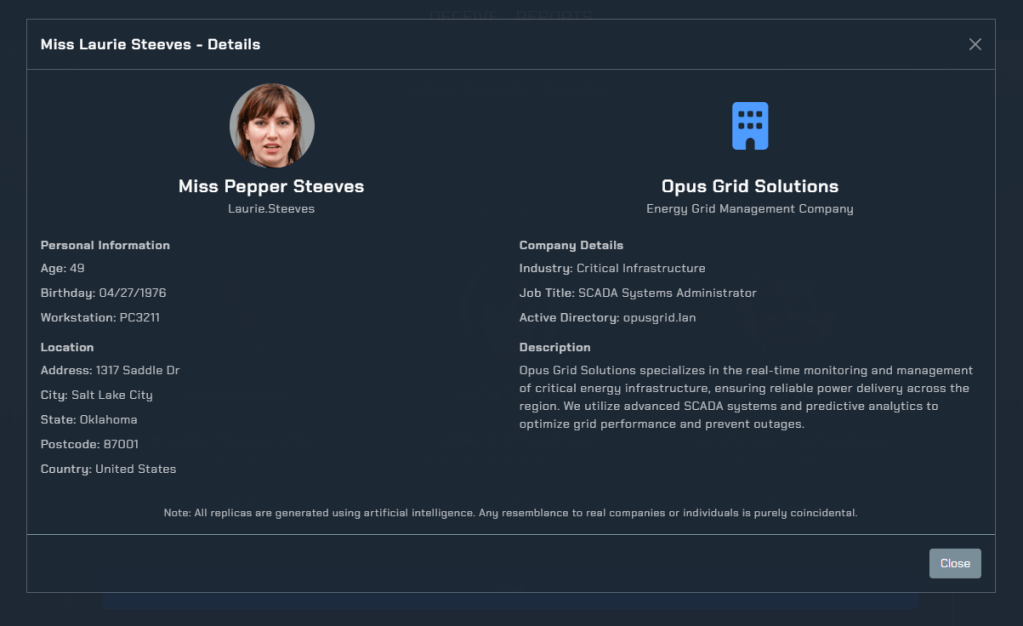
First, you’ll chose a “replica” who functions as the victim. This replica will be a user account for the main victim and a whole active directory forest for the organization that the victim is a part of. The victim names, images, organizations, and roles are AI generated allowing you to create a unique user and organization with every simulation.

If we view extra details for a user, we see their username and Active Directory domain: in the image below, the user account is “Laurie.Steeves” and the Active Directory domain will be “opusgrid.lan”. If chosen, this will be our Victim 0.
After selecting a replica, we’ll set how we want to run our deception operation. Note: At the current time, DeceptionPro supports only Windows environments with Linux and Mac environments being planned. DeceptionPro provides the following options: uploading a payload directly or staging an environment.

Uploading a payload will result in a standard sandbox type of experience: namely, the file will be ran automatically once the simulation starts. The default option is to start the file from the Download’s directory, but can be changed.
The staging environment will set up the network without running a payload, leaving you to perform activity on a host as you see fit. Functionally, this allows you to bypass the restriction of needing to upload a 50MB file. Want to run a 600MB file? Want to run a “Click-fix” command from an infected website to see the whole infection chain? You can do those things. Once the environment is started, can connect connect to the Victim 0 device via VNC allowing you to start the operation however you see fit.
The final miscellaneous settings help you set the environment to your needs.
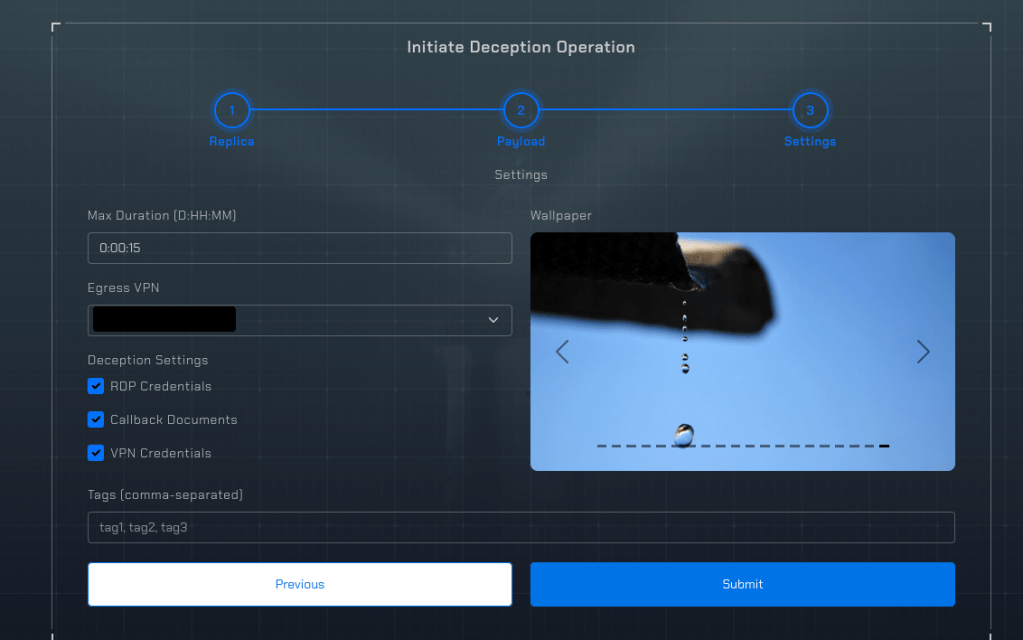
- Duration – This will depend on what you are trying to capture: unlike a sandbox, you aren’t limited to just the initial activity. If an infostealer steals credentials, do you want an environment available for them to connect to? If it is an initial access tool, do you want to monitor for hands-on-activity? This choices will influence how long you should to run the operation.
- Egress VPN – DeceptionPro offers VPNs to set the victim’s egress to several different options located around the globe. This allows you to be intentional if you know what geolocations are targeted and which may be advantageous for your deception analysis.
- Deception settings – These settings allow you to seed the machine with credentials or canary documents. If these credentials are used to access the machine after they are stolen or if the documents themselves are stolen, DeceptionPro will let you know.
- Tags – These can be applied here to track your operation; they in this setup and can also be applied later as you see fit. They are useful for tracking what your deception operation is monitoring or what your deception operation found.
For the purposes of this blogpost, we are going to upload a file but not disclose information regarding that file or specifics of our analysis and deception
The deception
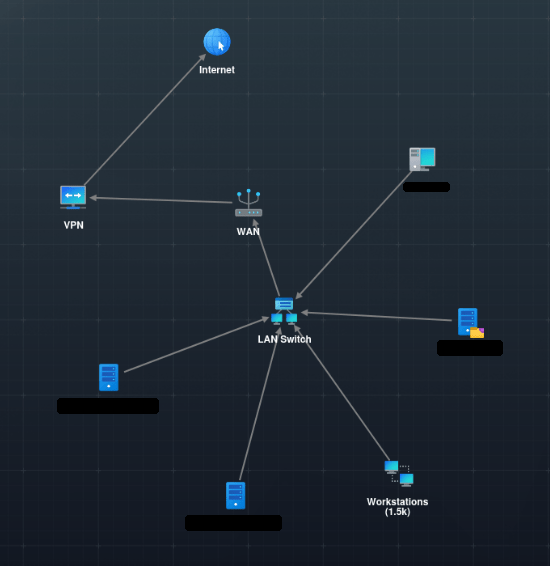
As mentioned previously, DeceptionPro starts up a realistic active directory network. Pictured below is a sanitized overview of our analysis.

The analysis environment takes a few minutes to spin up, but for good reason: the network they set up has a large number of hosts and networked devices. An actor enumerating the network will see may devices including enterprise servers, file servers, and more than 1 thousand workstations connected to the network. DeceptionPro spins up networks like this for each analysis.
For me, it is hard to overstate how useful this network generation is. I’ve tried doing this on my own, but the level of orchestration and ease that DeceptionPro provides is amazing.
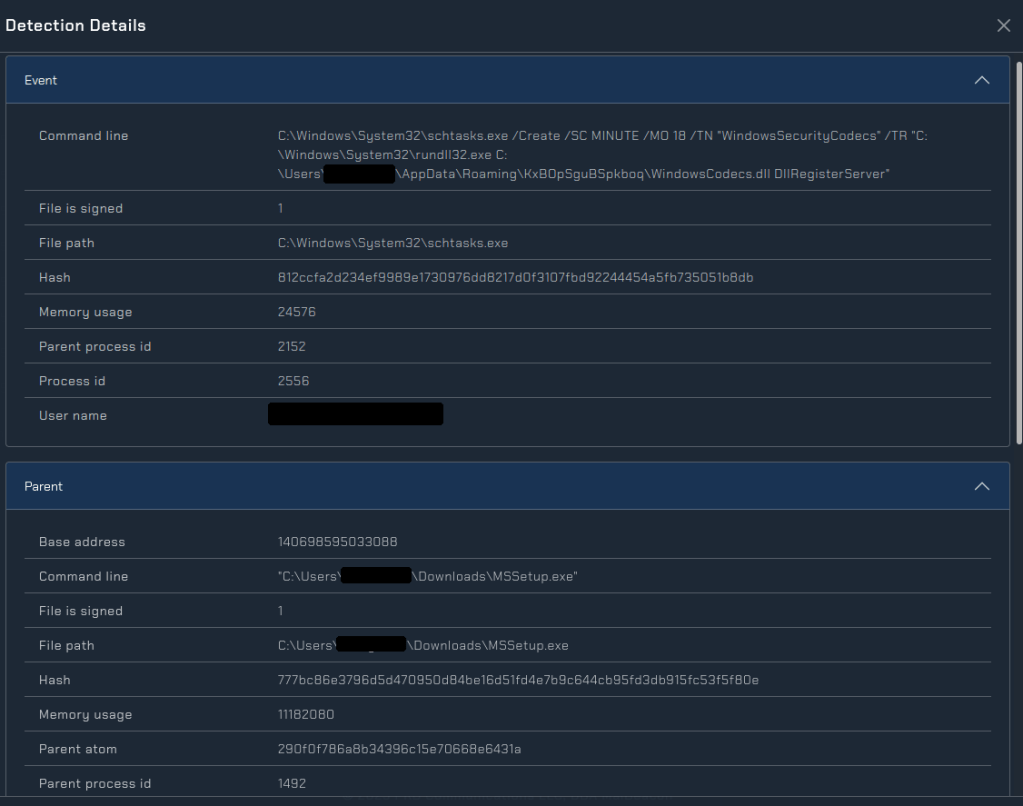
The left side of the overview provides the main content for our Deception investigation. Since we ran an executable, we’ve already received detections from the endpoint detection agent installed on the host.

From the detections tab we can see that the agent on the host has logged 12 detections. These include the execution of rundll32 and the creation of a scheduled task on the host. By clicking into the detection, we can see the details: the scheduled task is set to execute rundll32 on a regular interval. It is a result of this scheduled task that the most recent detections are execution of that persistence. When additional activity occurs on the host, we’ll see it here.
The network tab—as the name suggests—allows us to see the network traffic to and from the initial victim. A packet capture of this activity can be downloaded from the artifacts tab.
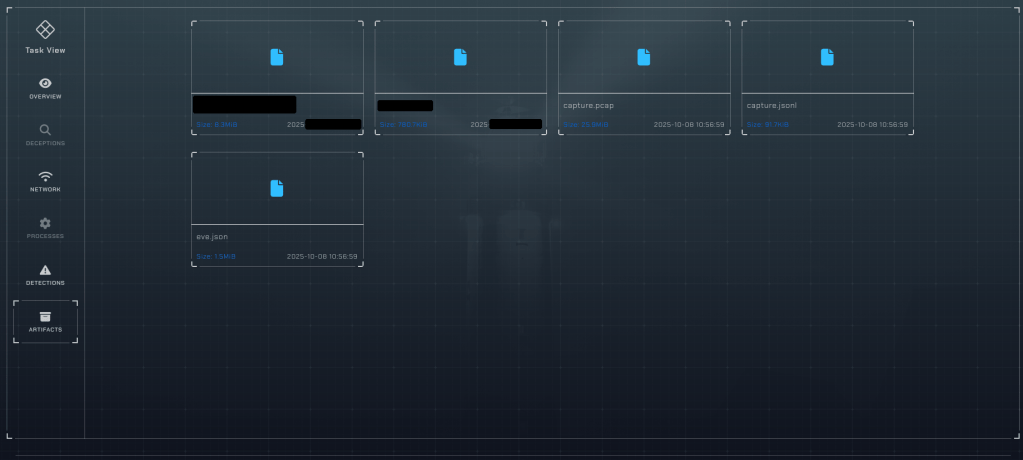
Looking at the artifacts tab, we see both the initial file we uploaded and the DLL that was dropped for persistence. We can easily access the network logs and event logs from the host. As our deception operation continues, we can easily retrieve any new payloads that are dropped into the network.

Enhancing our vision
DeceptionPro allows us to get great visibility into the post-exploitation of specific malware and actors. The only other options to get this level of visibility is through IR reports (which are rare to be released), through experiencing the incident ourselves, or through research like the DFIR Report.
I myself have had great success with DeceptionPro. I’ve tried creating my own labs to do this type of monitoring before, and it isn’t easy. So to be able to create a new environment within a few minutes and start gathering intel almost instantly, is amazing. I recommend checking out DeceptionPro and showing your orgs how it can empower your investigations and defenses against cybercrime.

One thought on “DeceptionPro: getting ahead of cybercrime”